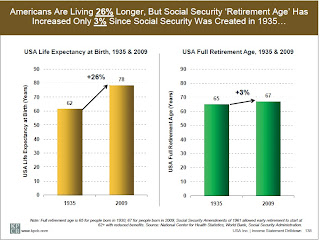
5 charts from AEI show how much trouble Social Security is in
Although, to be honest, you don't even need five charts; the first two charts do the job just fine.
All five charts are here.
As these charts show, Social Security is in deep financial trouble. Unfortunately, it's not the only program dragging the U.S. towards the debt cliff. As Mark Steyn so clearly articulates:
Michael Tanner of the Cato Institute calculates that, if you take into account unfunded liabilities of Social Security and Medicare versus their European equivalents, Greece owes 875 percent of GDP; the United States owes 911 percent - or getting on for twice as much as the second-most-insolvent Continental: France at 549 percent. ...The debt crisis is here, and the United States federal government is out of money. The status quo is not an option, because the government's cheap line of credit is going to run out.
The 2011 budget deficit, for example, is about the size of the entire Russian economy. By 2010, the Obama administration was issuing about a hundred billion dollars of treasury bonds every month - or, to put it another way, Washington is dependent on the bond markets being willing to absorb an increase of U.S. debt equivalent to the GDP of Canada or India - every year. ...
There's a famous exchange in Hemingway's The Sun Also Rises. Someone asks Mike Campbell, "How did you go bankrupt?" "Two ways," he replies. "Gradually, then suddenly." We've been going through the gradual phase so long, we're kinda used to it. But it's coming to an end, and what happens next will be the second way: sudden, and very bad.
(h/t E!!)


